


Creating a Pumpkin Counting Algorithm
Simple python tutorial using scikit, matplotlib to count numbers of pumpkin through pictured generated by UAV drones to help farmers.


Ah yes pumpkin counting, what a trend. There are many websites talking about it, how it would help farmers plant 40.000 pumpkins more [1] and you can read it your own on that part, it’s basically just one google away for more details.
For some context, farmers usually have hectares of land to grow pumpkins and it’s just impossible to count all of the pumpkins they have with fingers. By then they would have difficulties deciding how much herbicide, water, etc to necessarily supplies the total of pumpkins that actually turns into fruit and how much seed they would need to grow more. I guess that’s how drone imaging and the pumpkin counting algorithm could help farmers in Denmark to grow 40.000 pumpkins more.
The one thing that really intrigues me is, how hard can it be to make the code? I recently joined a UAV team in my university that I’m really on board with this whole drone and computer vision thingy! It just sounds so geeky and fun lol. Turns out it’s not as fun as I thought, I was taught C++ and OOP in C++ in a very limited amount of time while being expected to be able to make a code on my own in C++ to do a visual recognition task. They allow me to play around with last year's quadcopter drone code though. Otherwise, it’s not very helpful as I mostly fail to understand the hundreds of lines on different files let alone also really new to OpenCV.
So I did the most reasonable thing one can do, even though my mentor suggested me to read the documentation. Perhaps I’m just not that smart enough to understand OpenCV documentation at one time read.
Prerequisites
Prerequisites are just a fun list so you can make sure you can also create the code your own!
Python3
Jupyter notebook or Google Collab
Pip
Scikit
Matplotlib
Code Breakdown

The first thing you want to do here is importing packages, so when you use any improted funcitons it wont throw an error, you could also use just a package, but later you should wish to import a specific function from that library you should specifiy that out to optimize the code runtime, but for now, if you wish just to follow along with the tutorial you could just copy and paste the code

So I created a variable called img2. I actually also created img1 but I destroyed it in the process because somewhere in the steps it just failed. Nevertheless, the name should not matter, its just a variable name.
the first line is being inserted a picture named ‘sample_6.jpg’ and the next line being io.imshow(img2) it stands for “please show img2” and so the program shows it, cute & dandy isn't it?

Okay because the original image is originally in RGB(Red, Green, Blue) format now we want to turn it to HSV(Hue, Saturation, Value.) Remember! We want to count the pumpkins and the easiest way to do it because we know pumpkin is bright-colored and stands uniquely from the background! So we want to extract the Saturation channel from the image!

Alright, you may feel looking at the ax0,ax1,ax2, etc like “what the fuck are those.” Worry not it just looks fancy it’s not as intimidating as you might think. Think of it like this, fig is for figure then look at plt.subplots(ncols=4), ncols state how many columns and there is 4, for the: RGB, Hue, Value, Sat. So i have to create ax0,ax1,ax2,ax3. then I proceed to call imshow function just like in the first cell to show the image.
So substantially, the point of this is to see how can we make the pumpkin color pops out to the point it’ll be easier for the code to determine which is a pumpkin and which isn’t. Because color is adding a third dimension to the pic it’s justifiable if you want to make as clear as possible just make it so the program only counts the pumpkin from 2 different pixel colors instead of uh hundreds? We could do it by thresholding the image.

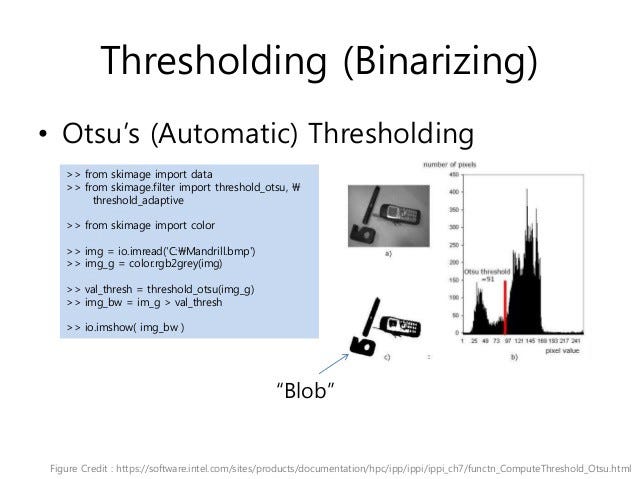
So as you can see, I created a variable called thresh2. Yes, there was thresh1 and I also deleted because I did something wrong about it. Always remember, in the process of studying, there’s no need to be ashamed for doing something wrong. Mistakes are inevitable. I called a function “threshold_otsu” [2] Thresholding is sometimes called binarizing, basically converting the image to only 2/biner significant color. Black and white.
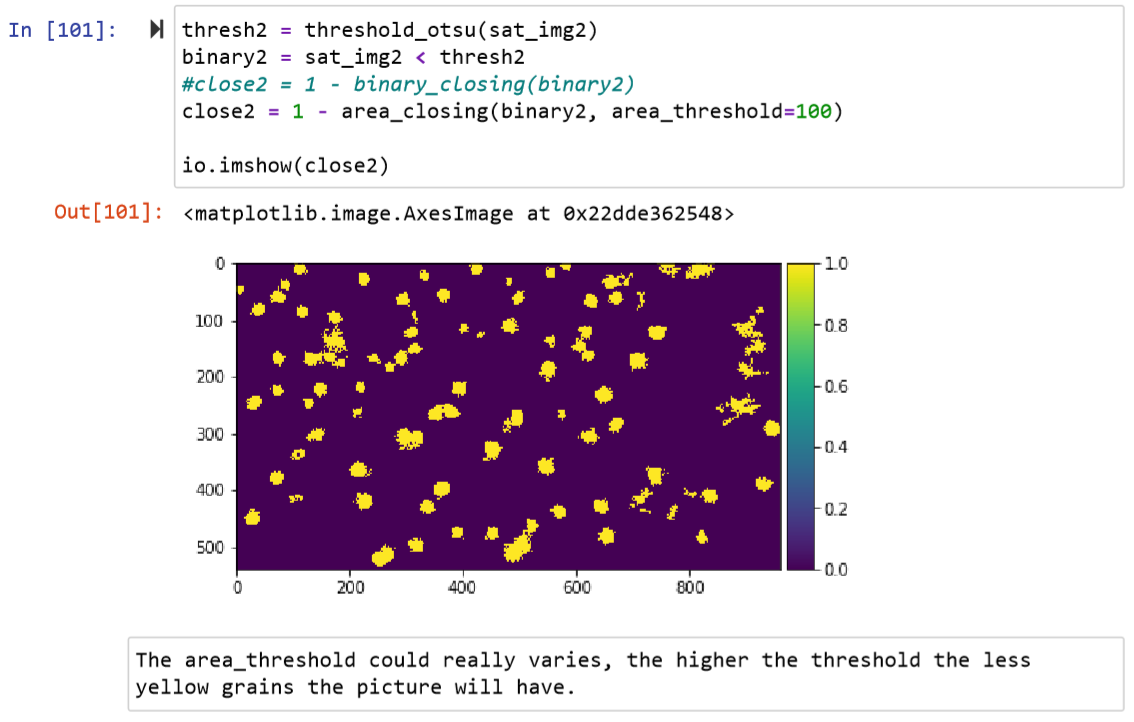
So in the same cell, I added a new function called area_closing. I know I know if you compared it with the original pumpkin image there's some false positive that it also identifies some leaves. But look at the bright side! There are so many blobs identified!

What area_closing actually does, it removes the dark structures of an image with a surface smaller than area_threshold. We decide how big and how small the area threshold here. As you can see in the parameter. Oh yeah one more thing, when it comes to the imported function, you don’t really need to specify each of the parameters to get the function works. For example, in my code above I only wrote:
area_closing(binary2, area_threshold = 100)
See the docs gave an example of the usage of the function with way more parameters such as connectivity, parent, tree_traverser. If you’re not sure about what it does, you could always experiment it in the code and see what changes.

Here I used the label function from scikit image. At first, I didn’t know how to make the counting algorithm so I searched in stack overflow and found this

This may sound dumb but the skill to be able to do google properly is required. I still didn’t understand the explanation on StackOverflow so I called my friend and he asked me to read scikit documentation based on what I’ve found on stack overflow. Most of it talks about this thing called label function.

Above is the brief description of what the label function does, if you’re still not convinced nor understand, you can read what the function returns.

Alright, so as you can see it’ll return two things. The labeled array and the number of labels. Because our job is only to count the pumpkins existed in the image. We would only want to see the total number of labels. Because of the function returns two things, it’ll return two things inside an array, if we only want to see the total number then we set in with print(result[1]). Because in python, an array started from 0.
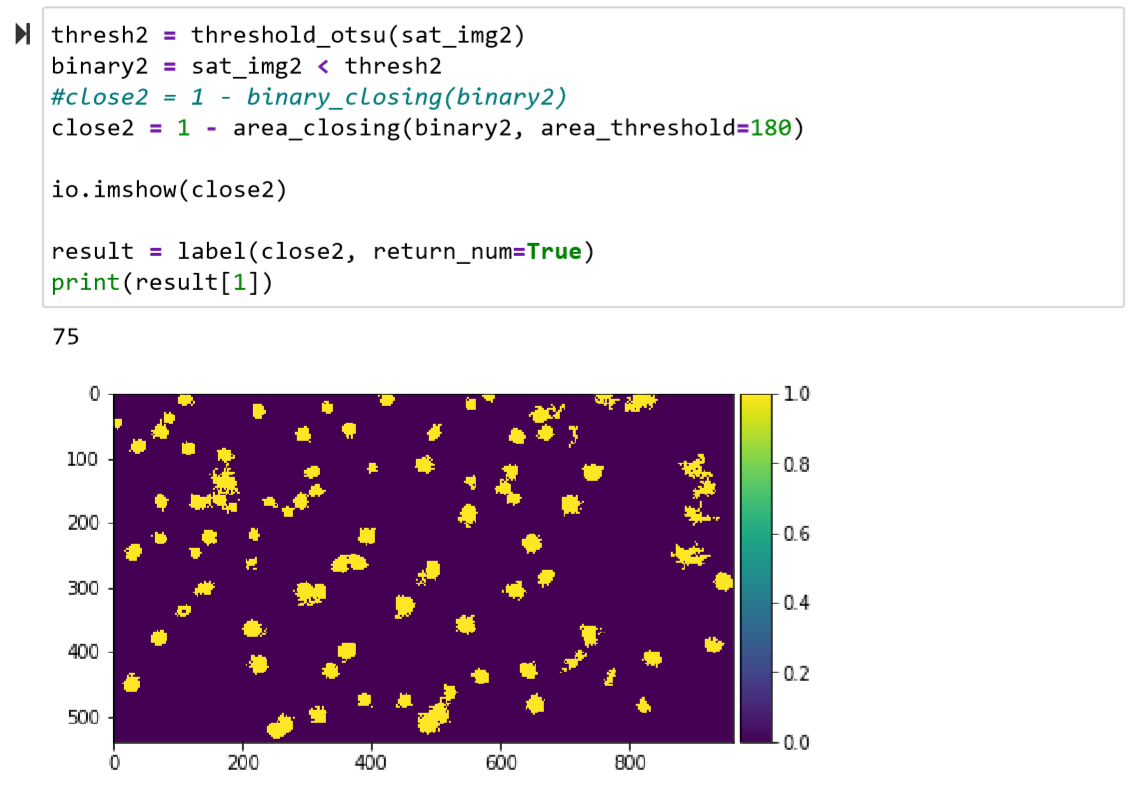
I created a variable called result and uses label function and passing the image of close2. The function returns a number of 75. That means it counted the blob in the image and it concluded there are 75 pumpkins.
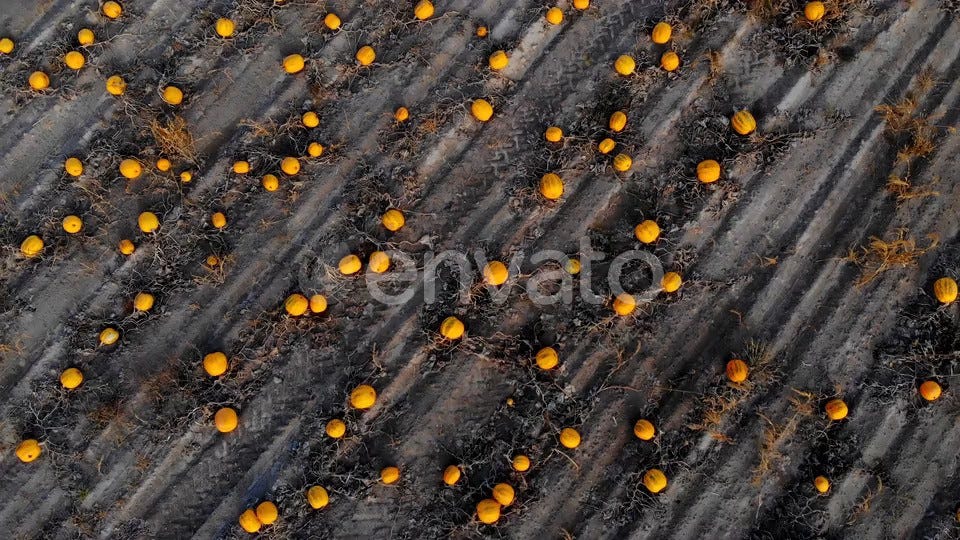
Okay, time for my moment of truth. To decide how good my algorithm actually is I counted all the pumpkin by hand. Don’t scroll below if you don't want to get spoiled! I count it by copy-pasting the image to paint and count it by there.

Ah yes, the moment of truth moment, when you realized you have finished the job. The blast of the excitement of the satisfying outcome. It actually has 79 pumpkins!! Damn, I couldn’t be happier to say the code actually works. 75/79 pumpkins? It’s actually great! But I don’t think its actually fair to judge the algorithm just by giving 1 input of sample image. The problem is the scarcity of the pumpkin aerial footage. I even got that image from my friend instead of my own google search lol. So I head out to Google search right.
I found that the Envato overlay actually tells me that, well obviously from the Envato website. So I searched there and found it’s actually a video of the pumpkin aerial footage. How splendid!! So then I put all the code together in 1 cell and change the input image.


It literally blows me away on how accurate the code is. I couldn’t be happier to inform you that. The funny thing is, it actually still has false positive and false negatives.

Let’s talk about the flaw of the code. Because I used the counting based on the saturation. The color that pops out from the background will be counted including the somewhat orange leaves. -_____- So that includes as false positive.
The false-negative is when the pumpkin is too close to each other. The code would simply count them as 1 pumpkin instead of 2.
Putting those 2 types of false together, you get a quite accurate outcome. How funny? Well I mean does it really matter when the end justifies the means? It delivers close to 100% accuracy. Well, that only means one thing. Test it with more images to test how accurate the code is.


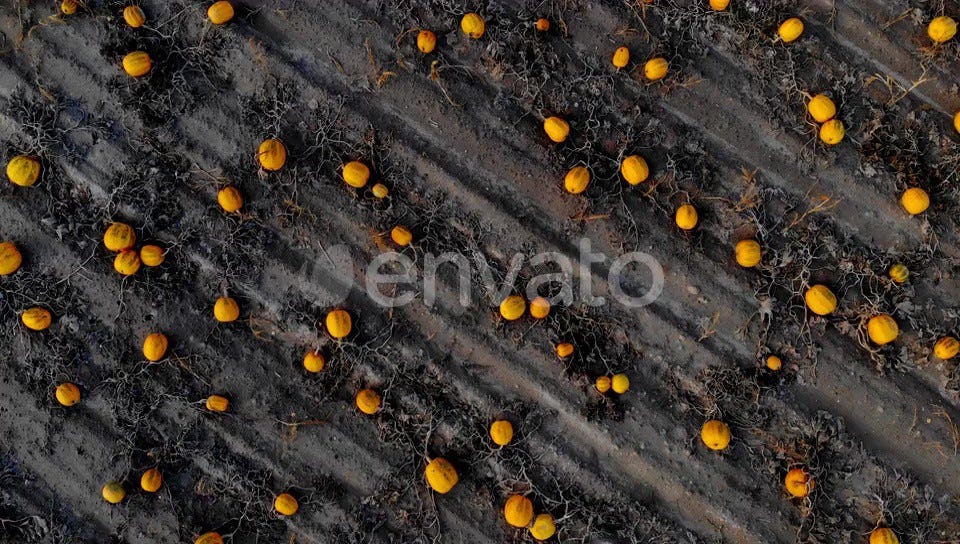
I selected 3 candidates to test on the code. I named them scene1, scene2, scene3.

“Code menghitung 54 blewah, sebenarnya ada 50.” Basically means that the code counts there are 54 pumpkins while the actual number that I count by hand is 50. Don’t believe me? I’ll put the original image of scene1, scene2, and scene3 in the end of the article.
Oh yeah, let me talk about how i did that.

So as you can see, I print some strings and the {result[1]} the part where it actually prints the total pumpkin counted by the code. Here’s how I did it. I created a variable called result and use label function but I don't directly print the variable result. Instead, I created a variable called stuff and add a string and embedding the result (print the 1 column array, which I wrote in [1])variable in the middle of the string. Then I print(stuff)


All right scene1, scene2, and scene3 prove a really exciting result of almost accurate and accurate! I didn’t expect it to returns with the exact result but there they are!
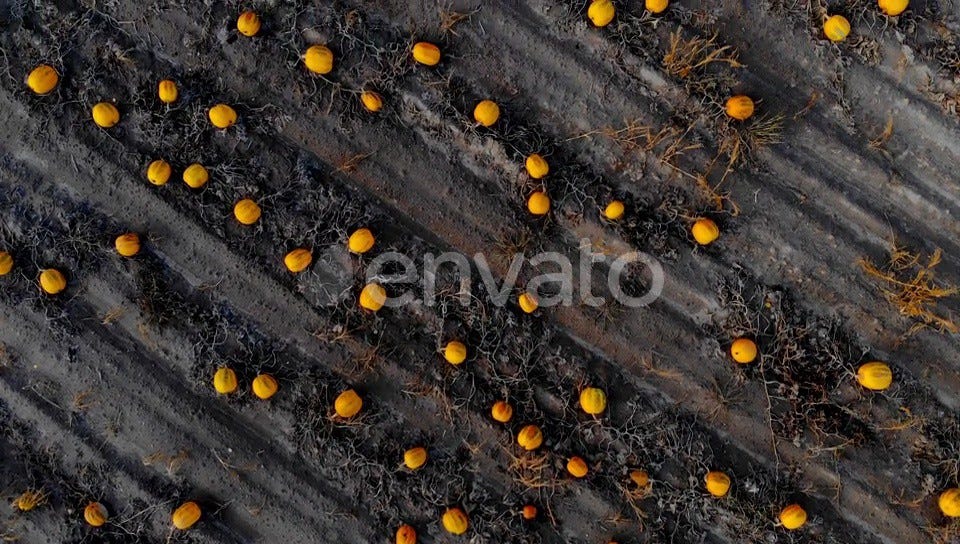
I can’t upload scene3 because it seems I have reached the maximum number of pictures uploaded allowed by Medium. Anyway, those are scene1 and scene2 if you want to see the moment of truth yourself! I really enjoyed writing the code and writing this article. (the moment that I initially wrote this article is that I wrote it in Medium, I recently resurface this article in substack and I dont have the original scene3 because I dont keep that old files hahaha)
I was thinking that I might want to make a video explanation about it, or maybe even stream the experience so you fellas could ask everything you want? In my head that sounds like a good idea. Let me know what you think in the comments! Don’t forget to follow me in medium because the next project is actually to implement a machine-learning algorithm to the piece! See you soon!
Sources
[2]https://scikit-image.org/docs/dev/auto_examples/segmentation/plot_thresholding.html
[3] https://icr2018.org/northwest-territories/thresholdadaptive-no-documentation-skimage.php
[4]https://scikit-image.org/docs/dev/api/skimage.morphology.html#skimage.morphology.area_closing
[5] https://scikit-image.org/docs/dev/api/skimage.morphology.html#skimage.morphology.label